Each year, the Swedish Energy Agency publishes a report providing a detailed analysis of Sweden’s fuel consumption. For the first time, this year’s report is available in an interactive format, developed with support from twoday. Visualized in Power BI, the report offers a dynamic and engaging way to explore the data.
The new digital, data-driven format allows readers to dive deeper into information about fuels on the Swedish market.
 The Fuel Report is one of the Swedish Energy Agency's most requested reports.
From PDF to Power BI
The report is built on data from fuel suppliers and other organizations, providing insights into volumes, energy content, and greenhouse gas emissions from a lifecycle perspective. In previous years, stakeholders could download the report as a PDF from the Swedish Energy Agency’s website.
In autumn 2023, we at twoday held workshops with the Swedish Energy Agency to support the creation of this year’s report, now visualized in Power BI. The workshops aimed to demonstrate how the agency could maximize the potential of Power BI while also enhancing their knowledge of the tool to empower them to create and visualize its own reports in the future.
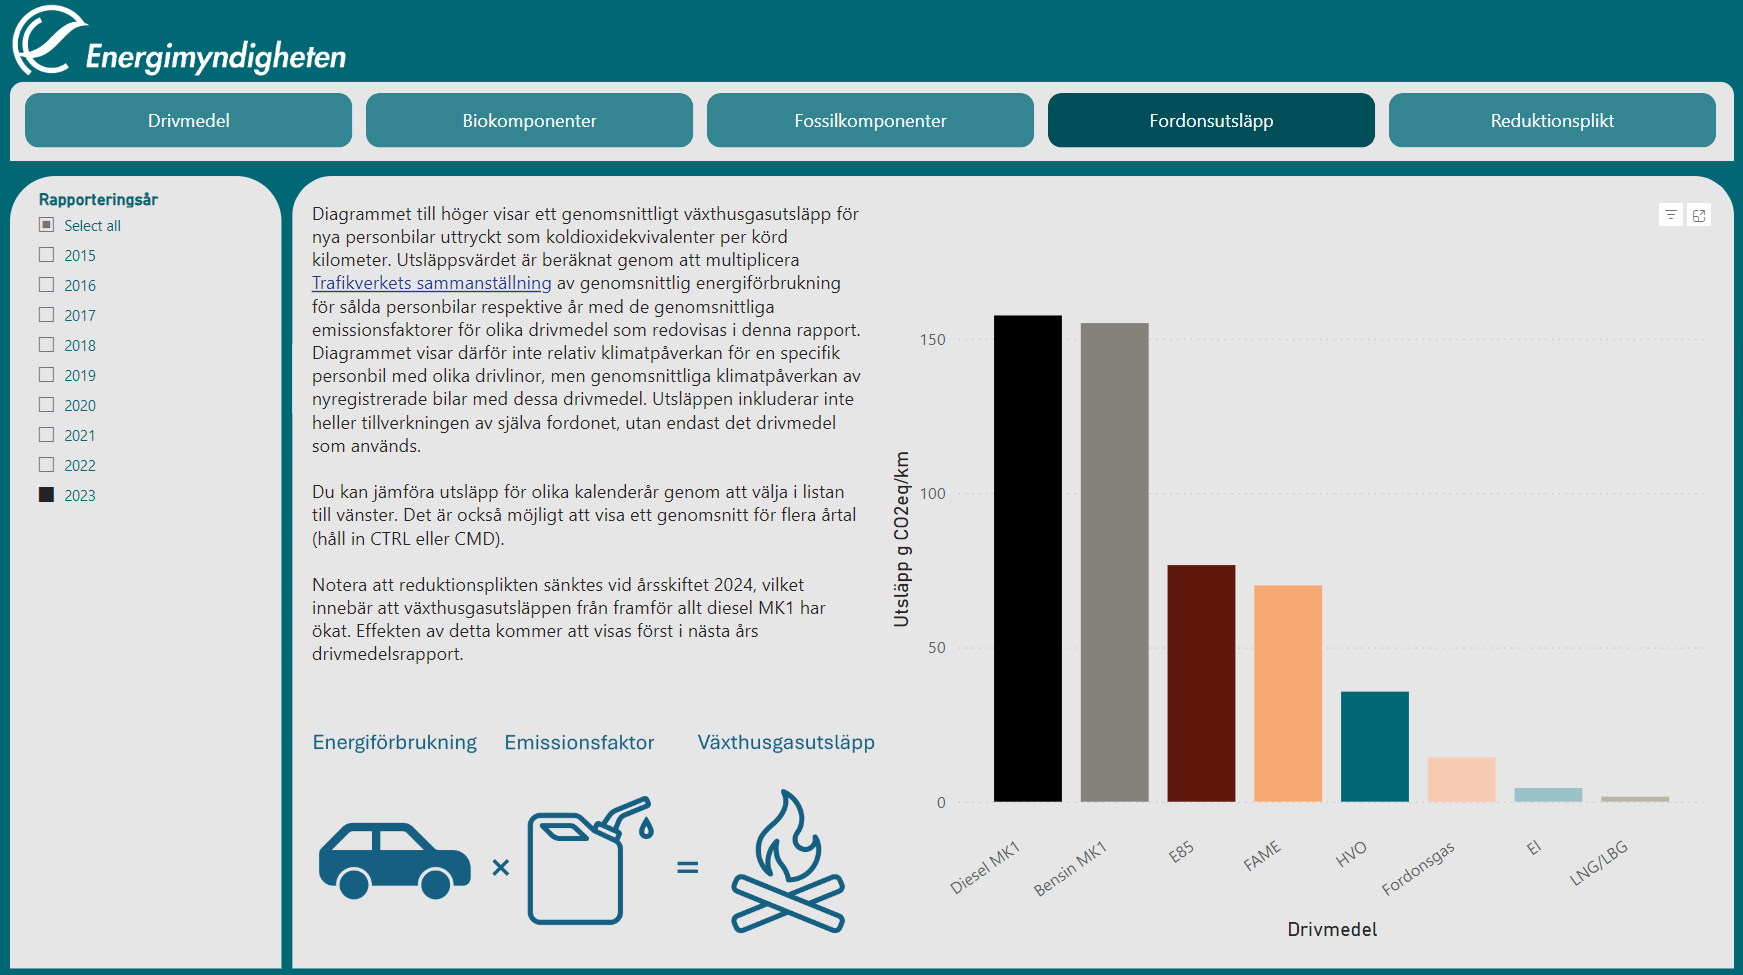
Combining the vision of the Swedish Energy Agency with consultancy support from twoday, it has become considerably more accessible for stakeholders to access the report. With Power BI, users can filter and visualize specific information of interest, facilitating deeper insights and more detailed analyses.


|

|
The same chart as above but filtered based on preferences.
Interactive insights with Microsoft Power BI
The Swedish Energy Agency chose Microsoft’s data analytics tool, Power BI, to publish information on fuel volumes, greenhouse gas emissions, raw materials, and countries of origin. In addition to presenting the data, the tool allows readers to customize the content and layout of the report to suit their needs.
– “By letting readers filter and sort the information they are interested in, we hope to increase the report's value for them,” says Noak Westerberg, analyst at the Swedish Energy Agency.
A report that can evolve and adapt
One key advantage of the digital, data-driven format is its reusability year after year, enabling earlier publication and providing readers with more up-to-date information. The goal is to continue refining and evolving the format based on user feedback and requests. For questions or suggestions about the report, readers are encouraged to contact the Swedish Energy Agency.
The report is available to all stakeholders on the Swedish Energy Agency’s website, offering an overview of the current state of the fuel sector, key trends, and its role in achieving national and international climate goals.
– “The Swedish Energy Agency’s Fuel Report is an excellent example of external reports. We continue to receive a lot of praise for it, and when I recently presented it to our counterparts in other EU countries, everyone was very impressed and curious!” says Noak Westerberg.
You can find the full report here👉 Swedish Energy Agency's Fuel Report
Interested in how twoday can help you with data visualization?
Fill out the form, and let’s have a chat!
Contact us
